
Core Web Vitals are three metrics Google uses to score real-world page experience: Largest Contentful Paint (LCP), Interaction to Next Paint (INP), and Cumulative Layout Shift (CLS). A page earns a "good" rating when most visits meet the target thresholds of LCP around 2.5 seconds or faster, INP approximately 200 milliseconds or faster, and CLS about 0.1 or lower. These three numbers feed directly into Google's page experience assessment, and missing any one of them puts real visitors through a slower, jumpier site than they should tolerate.
TL;DR:
- Most visits need to meet the target thresholds of 2.5 seconds for LCP, 200 milliseconds for INP, and 0.1 for CLS to pass Google's assessments.
- Large images, render-blocking CSS, and slow server responses are common causes of poor LCP, especially with oversized hero images or missing CDN.
- Heavy JavaScript, third-party scripts, and main-thread tasks significantly impact INP, and breaking up long scripts can improve responsiveness.
- Content shifts caused by late-loaded ads, image dimensions, or font swaps mainly affect CLS, which can be fixed by reserving space and setting explicit sizes.
- Improving Core Web Vitals requires targeted fixes prioritized by impact and effort, with regular testing through lab and field data over a 28-day period.
Table of Contents
- LCP, INP, and CLS: What Each Metric Actually Measures
- How Does Google Score a Page as Pass or Fail?
- What's the Best Way to Measure Core Web Vitals?
- Which Fixes Actually Move the Needle on Vitals?
- How Forge-web-studio Applies This on Real Client Sites
- Authoritative Docs and Tools to Bookmark
- Get Your Website Reviewed for Core Web Vitals Issues
- An Editorial Take on Where Teams Waste Time
- Sources
LCP, INP, and CLS: What Each Metric Actually Measures
Each metric tracks a different way a page can frustrate someone, and each has its own usual suspects.
Largest Contentful Paint clocks how long it takes the biggest visible element, usually a hero image, a headline block, or a video poster frame, to fully render. Slow LCP almost always traces back to server response time, render blocking CSS, or an image that's too large to load quickly. A restaurant site with a 4MB hero photo and no content delivery network will fail LCP before a single line of copy loads.
Interaction to Next Paint measures the delay between a tap or click and the moment the browser visibly responds. It replaced First Input Delay as an official Core Web Vital and it's brutal to sites with heavy JavaScript. If a mobile menu button takes 600 milliseconds to open after someone taps it, that's an INP failure, and the usual cause is a long main-thread task, often a third-party script parsing analytics or chat widgets right when the user tries to interact.
Cumulative Layout Shift scores how much content jumps around as a page loads. The classic offender: an ad slot or embedded video that loads late and shoves the paragraph you were reading three inches down the screen. Missing width and height attributes on images, late-injected banners, and web fonts that swap in and reflow text are the three most common causes.
Here's how a single symptom often maps to more than one metric:
- A hero image delayed by a slow third-party ad script hurts LCP directly and can spike CLS if the ad container has no reserved space.
- A chat widget script that blocks the main thread on load will tank INP the moment a user tries to scroll or click before it finishes executing.
- A web font swap that changes text size mid-load shifts every paragraph below it, which is a pure CLS problem with no LCP or INP overlap.
How Does Google Score a Page as Pass or Fail?
Google runs the numbers at the 75th percentile of real visits, not the average and not your best test run. That means a page only counts as "good" for a given metric if three out of every four visits, across all devices and connection types, fall within the target range.
The current thresholds:
Assessment runs on a rolling 28-day window of field data, so a fix you ship today won't show up as a confirmed trend for close to a month. If a metric doesn't have enough visits to generate a reliable score, Google's assessment rules still allow a page to pass on the remaining metrics in some cases, but two or more missing metrics mean the page can't be scored at all.
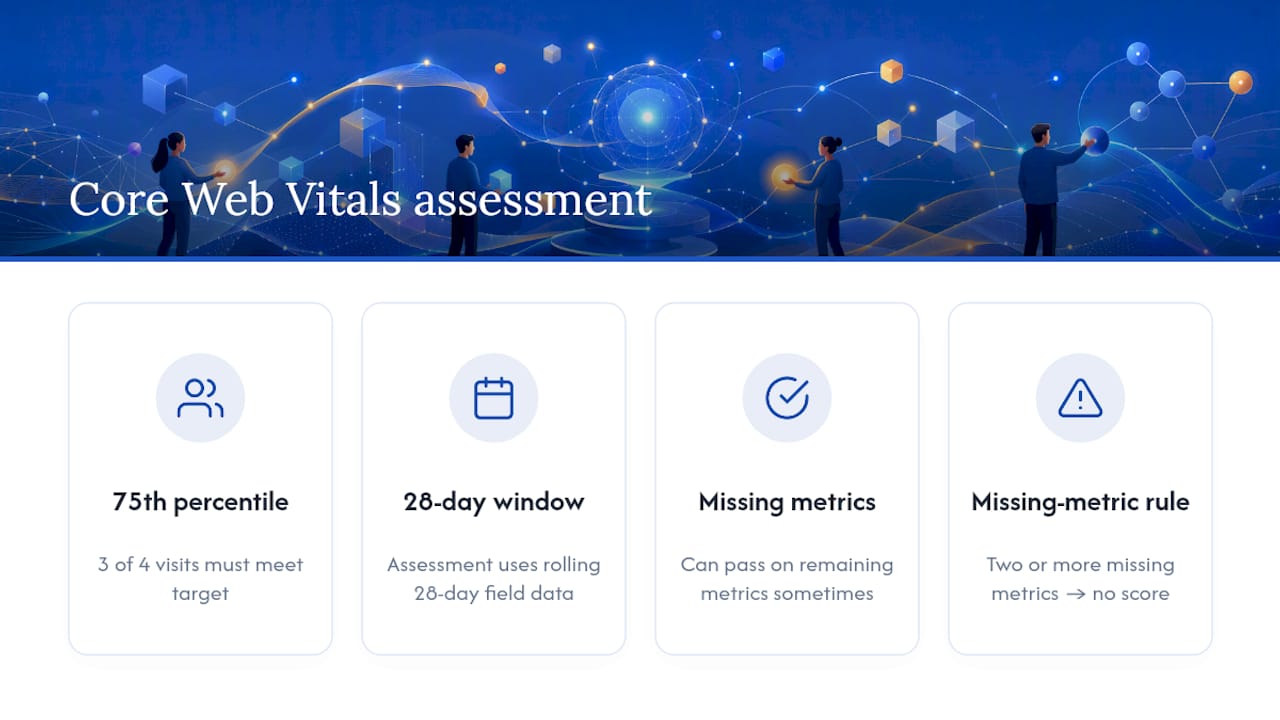
A page that "passes" can still be a bad experience for a quarter of your visitors. Hitting the 75th percentile threshold means most visits met the bar, but a significant minority could be experiencing poorer performance leading to frustration even while the site technically passes.
What's the Best Way to Measure Core Web Vitals?
Measuring Core Web Vitals well means combining two different data types: field data from real visitors and lab data from controlled tests. Field data, pulled from the Chrome UX Report through PageSpeed Insights or the Core Web Vitals report in Search Console, tells you what's actually happening to real people on real networks. Lab data, generated by Lighthouse or Chrome DevTools, gives you the diagnostic detail to find and fix the cause.
A workflow that actually works, in order:
- Check Search Console's Core Web Vitals report for a site-wide view of which URL groups are flagged poor or needs improvement.
- Identify your worst-performing pages, usually templates with heavy third-party scripts, image-heavy product pages, or anything with embedded video.
- Run a lab test in Chrome DevTools or PageSpeed Insights and study the filmstrip and network waterfall to find the exact blocking resource.
- Ship a targeted fix, then deploy and give it the full 28-day field data window before declaring victory.
For teams that want granular tracking beyond Google's dashboards, the web-vitals JavaScript library wraps the browser's PerformanceObserver API to log real LCP, INP, and CLS events straight into your own analytics.
Pro Tip: Test at least five to ten of your highest-traffic page templates, not just the homepage. A homepage that scores perfectly can hide a product page template that's failing INP for every mobile shopper on your site.
Which Fixes Actually Move the Needle on Vitals?
Not every fix deserves the same sprint priority. Start with the changes that take an afternoon, then work up to the ones that touch your architecture.
Quick wins for LCP:
- Compress and resize images to the dimensions they'll actually display at, and serve modern formats like WebP or AVIF instead of JPEG, which typically cuts file size by 25 to 35% at equal quality.
- Preload the hero image with a
<link rel="preload">tag so the browser fetches it before it discovers it deep in the render tree. - Strip render-blocking CSS above the fold, deferring anything that doesn't affect the first paint.
Quick wins for INP:
- Break long JavaScript tasks into smaller chunks, since main-thread reduction tends to produce bigger INP gains than image work alone.
- Defer or load third-party scripts asynchronously so they don't compete with user input for the main thread.
- Move heavy computation, like data parsing or image manipulation, into a web worker instead of running it on the thread the user is trying to interact with.
Quick wins for CLS:
- Set explicit width and height, or use CSS
aspect-ratio, on every image and video embed. - Reserve space for ad slots and iframes before they load, not after.
- Avoid injecting banners or notices above existing content once the page has already rendered.
- Use
font-display: optionalor a close-matching fallback font stack to prevent text reflow when web fonts swap in.
Work through fixes in this order: images and explicit dimensions first, since they're often a single afternoon of work with a practical image optimization guide to lean on. Then tackle JavaScript and main-thread reduction, which usually needs a developer sprint. Save server and architecture changes, like adding a CDN or switching to server-side rendering, for last, since those carry the most engineering risk and the least reversible cost.
Once a fix ships, rerun your lab test to confirm the immediate improvement, then watch the PageSpeed Insights field data trend over the full 28-day window before checking it off. Pair that with your conversion and bounce rate numbers. A website review checklist helps keep verification steps from getting skipped when a team is moving fast.
How Forge-web-studio Applies This on Real Client Sites
A typical website build goes through a sequence: a rapid audit that flags the worst LCP and CLS offenders, a prioritized fix list ranked by effort versus impact, and a mobile-first pass, since much service business traffic arrives on a phone, not a desktop. That mobile clarity focus connects directly to why slow websites lose customers before they ever reach a contact form.
Success gets measured using 75th-percentile field data across LCP, INP, and CLS, tracked alongside conversion lift and bounce rate. A page that scores well on a single Lighthouse run but still loses mobile visitors isn't actually fixed.
Authoritative Docs and Tools to Bookmark
Bookmark Google's Core Web Vitals documentation and the Web for the official rules. For testing, use PageSpeed Insights, Search Console's Core Web Vitals report, WebPageTest, Chrome DevTools, and the web-vitals library.
Get Your Website Reviewed for Core Web Vitals Issues
Most site owners find out their Core Web Vitals are failing when traffic drops, not before. If you want to know where your site actually stands, Forge-web-studio's responsive website development work builds performance and mobile clarity in from day one rather than patching it in afterward. For an existing site that needs targeted repair instead of a rebuild, the web design services page walks through how Forge-web-studio scopes that kind of project for Texas businesses.
An Editorial Take on Where Teams Waste Time
The conventional advice on Core Web Vitals treats all three metrics as equally urgent, and that's where most teams misallocate a sprint. INP usually deserves the first real engineering attention, not LCP, because main-thread bloat from third-party scripts is the metric most likely to be quietly getting worse every time marketing adds another tracking pixel.
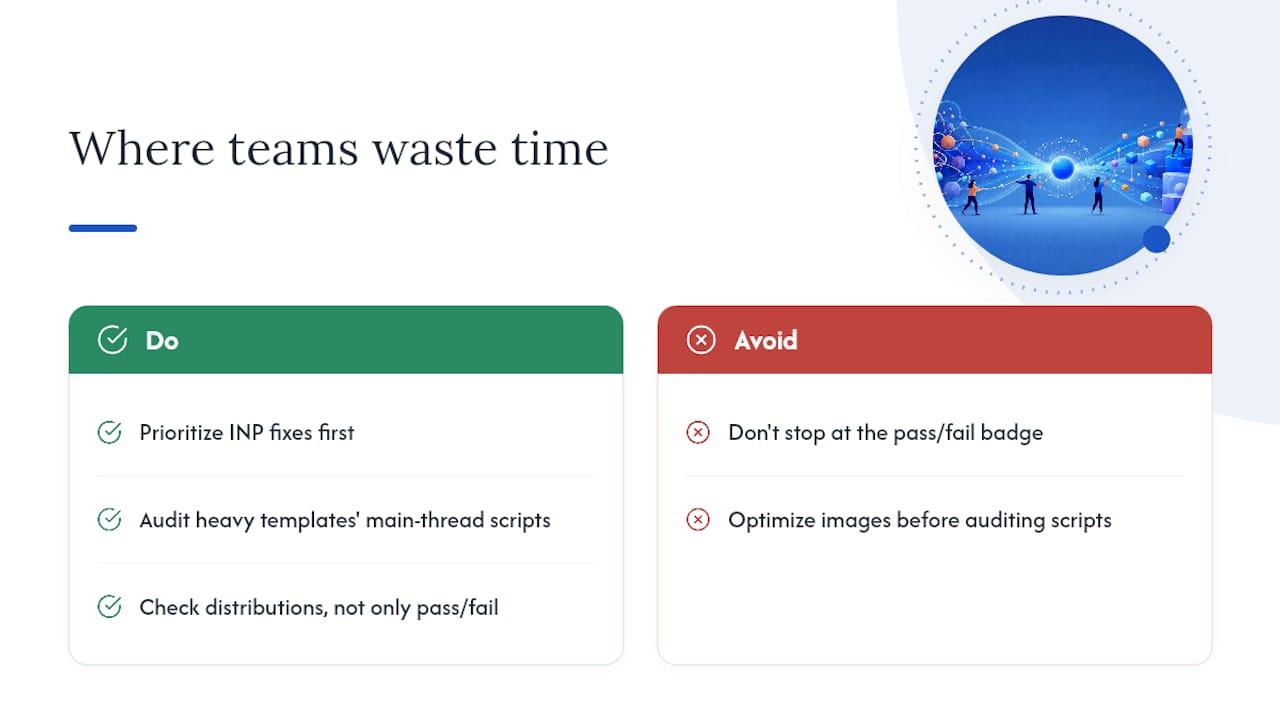
Passing scores get treated as a finish line when they're closer to a floor. A site sitting right at the 75th-percentile threshold is, by definition, still delivering a poor experience to a real slice of its visitors, and nobody's dashboard shows that group unless someone goes looking for it in the distribution, not just the pass/fail badge.
If there's one place to start, it's auditing your heaviest page templates for main-thread blocking scripts before touching a single image. Image compression is satisfying because it's easy and visible. It's rarely where the worst damage is hiding.
— Dylan
Sources
- Understanding Core Web Vitals and Google search results
- How the Core Web Vitals metrics thresholds were defined
- PageSpeed Insights / Web performance tooling
- Measuring performance (MDN)